
Physician 2024

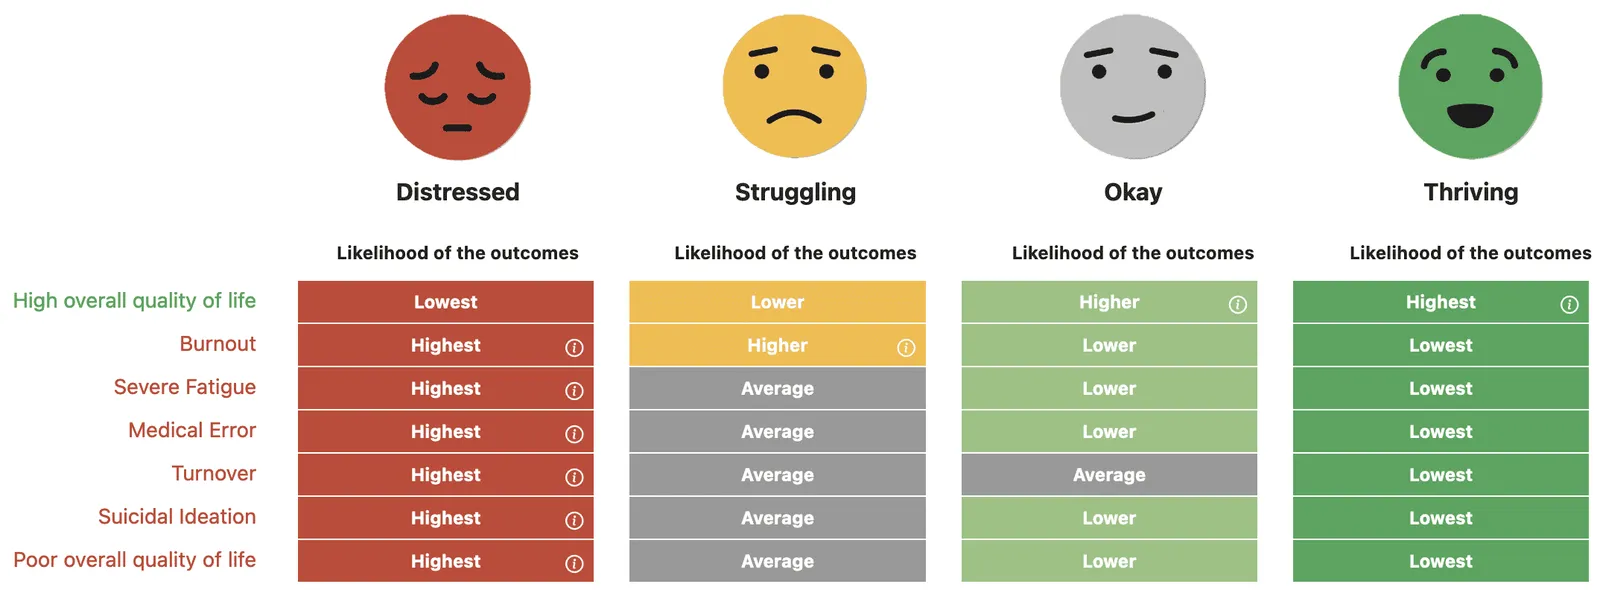
Well-Being Snapshot Likelihood of Outcomes Grid
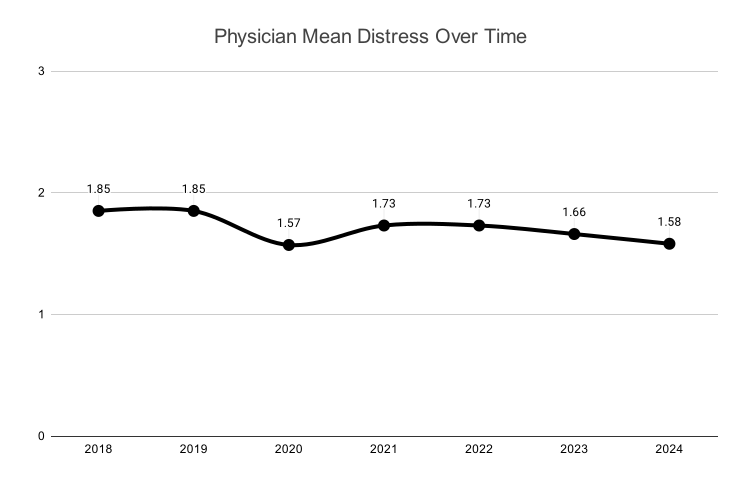
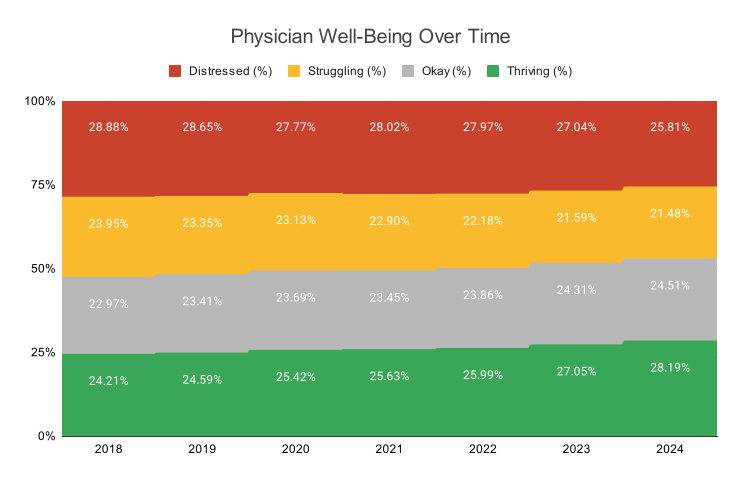
Well-Being Over Time
About These Reports
The Mean Distress Score report is a single number used to indicate increase or decrease in distress among all assessments. Higher numbers indicate higher levels of distress. The full Mean Distress Score scale for Physicians is -2 to 9.
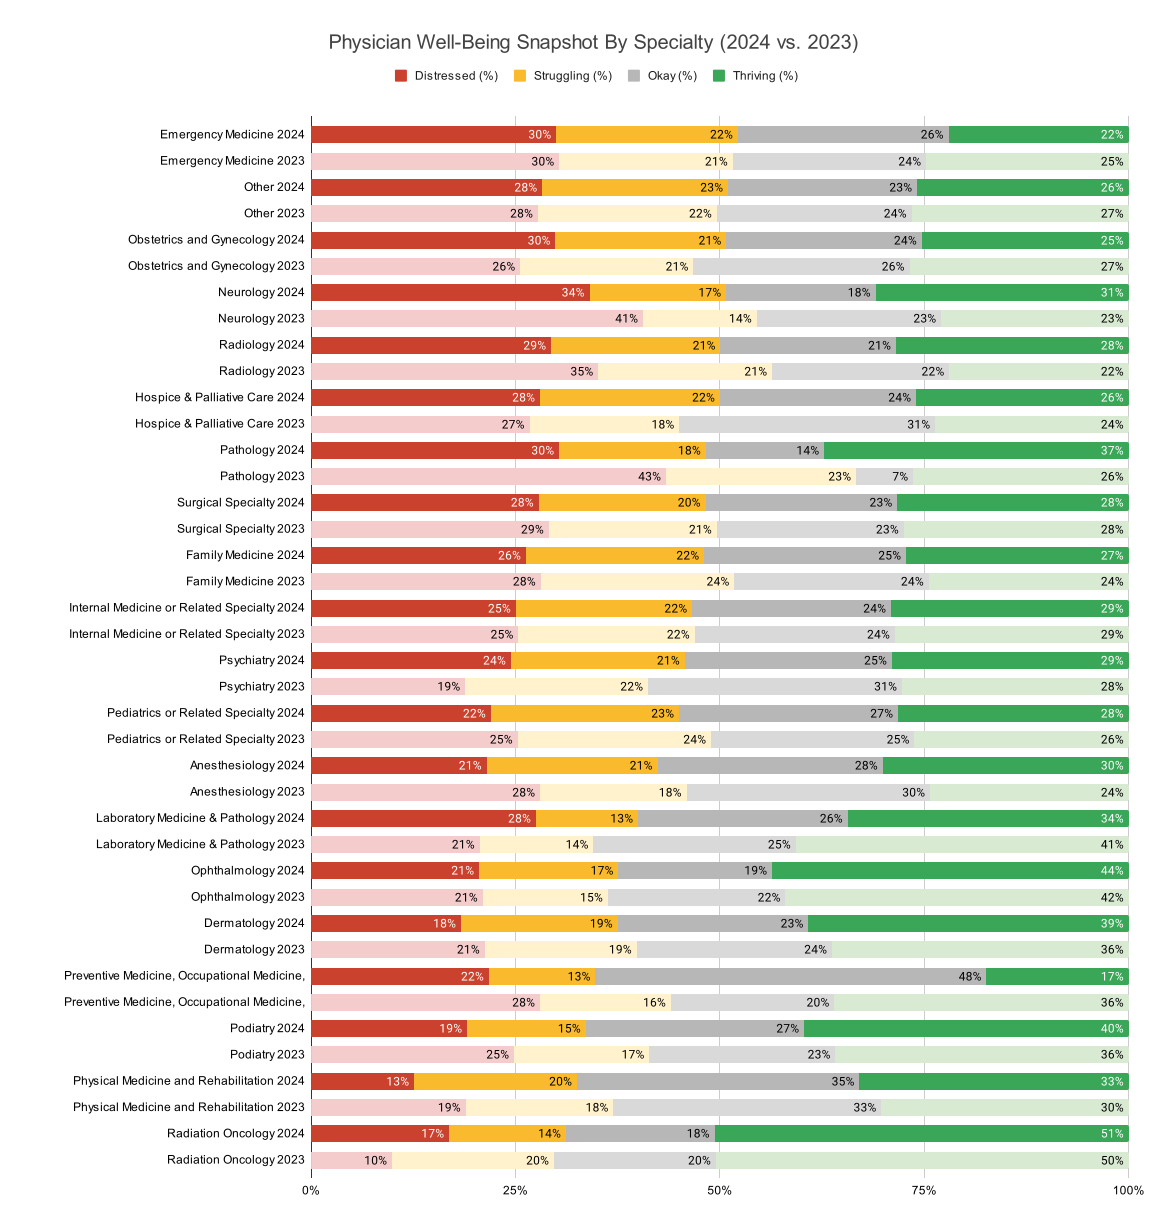
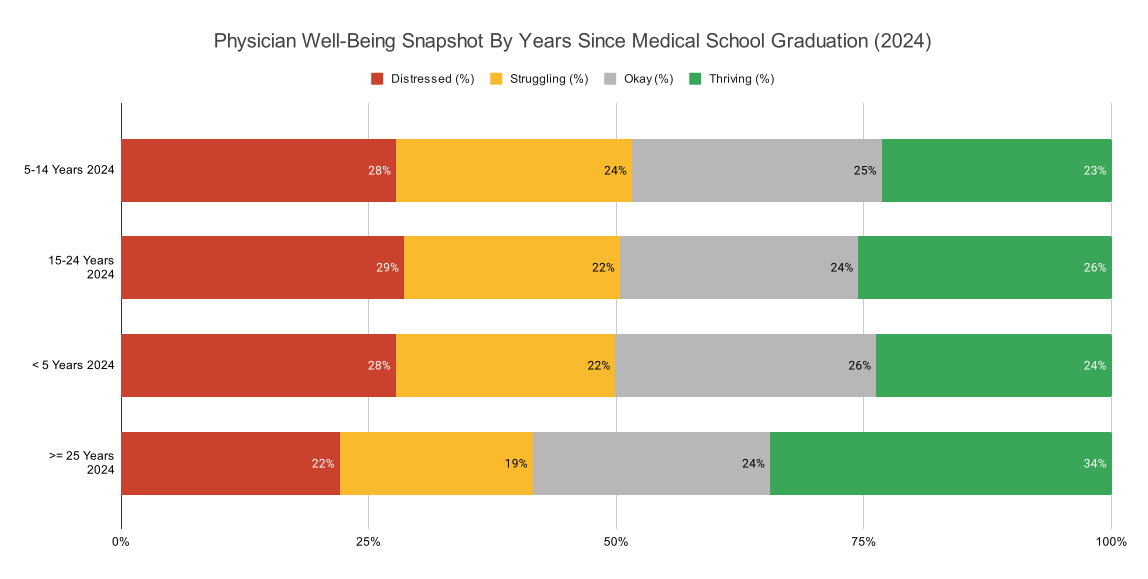
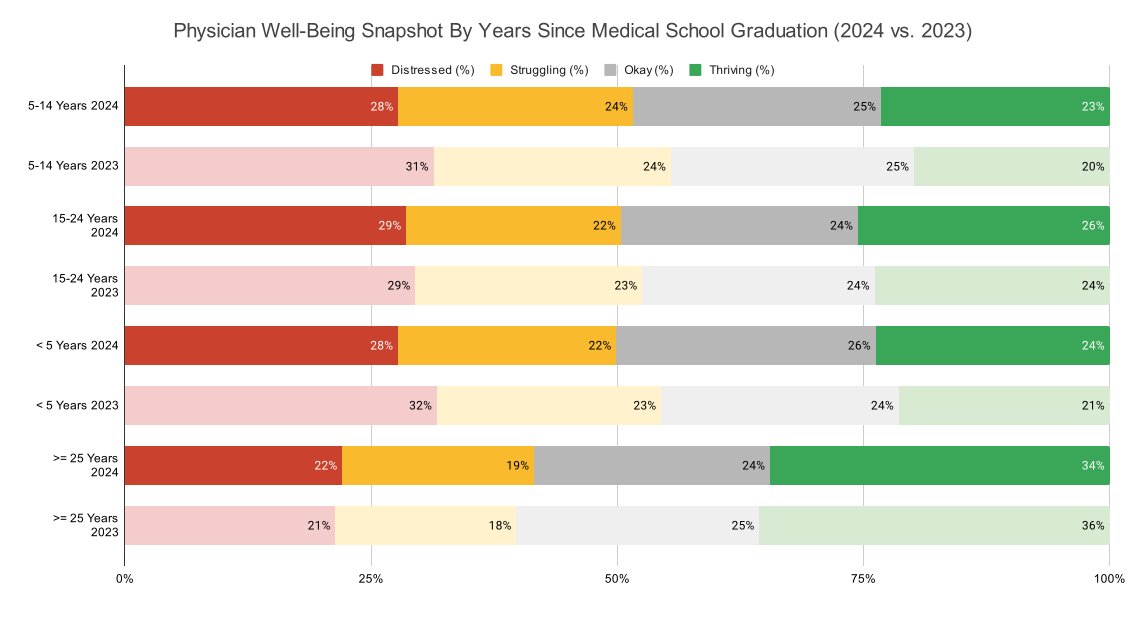
The Well-Being Snapshot report uses the Well-Being Continuum or 4 categories for well-being and distress including Distressed, Struggling, Okay, and Thriving. The likelihood of outcomes associated with each category can be found above.
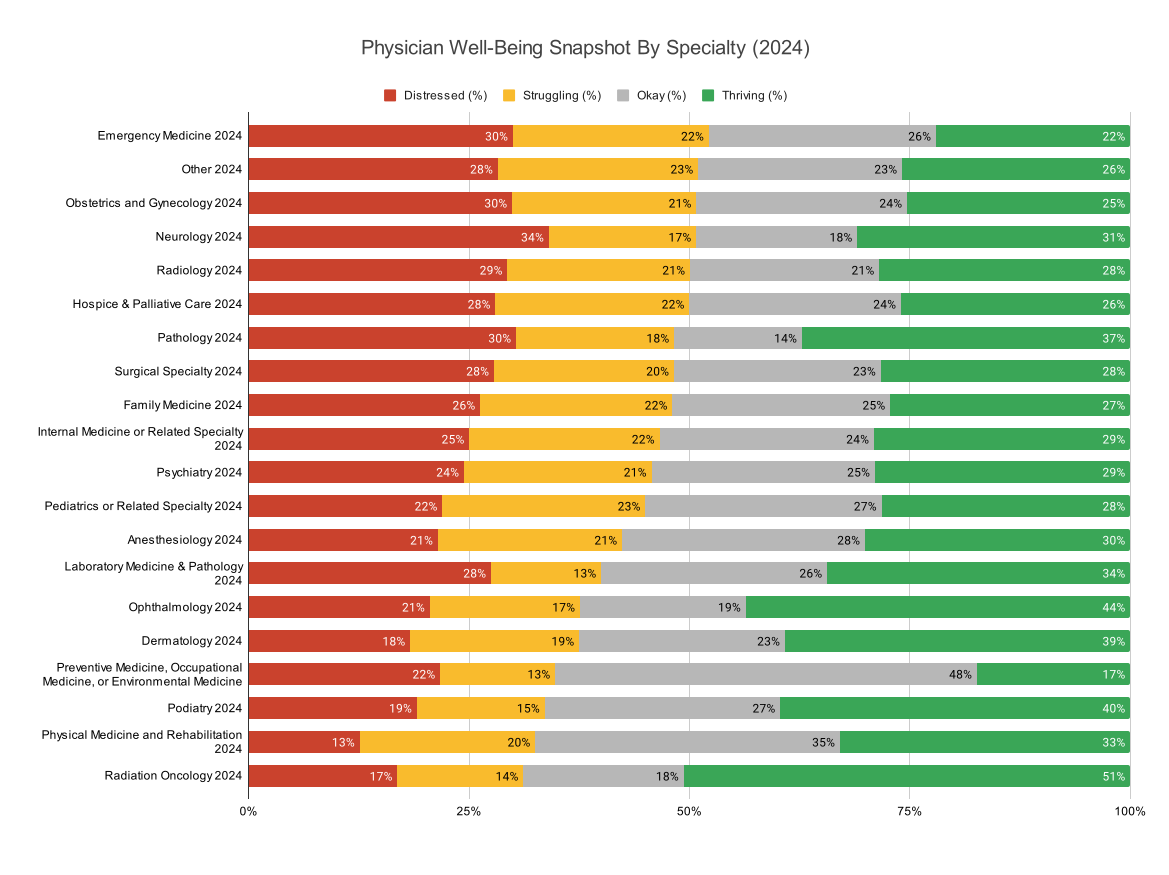
Well-Being Snapshot By Specialty
About These Report
The 2024 data is sorted from highest to lowest percentage of assessments in a combination of the Distressed & Struggling categories. The 2023 data is directly below the associated group for ease of comparison.
Well-Being Snapshot By Years Since Medical School Graduation
About These Reports
The 2023 data is sorted from highest to lowest percentage of assessments in a combination of the Distressed & Struggling categories.
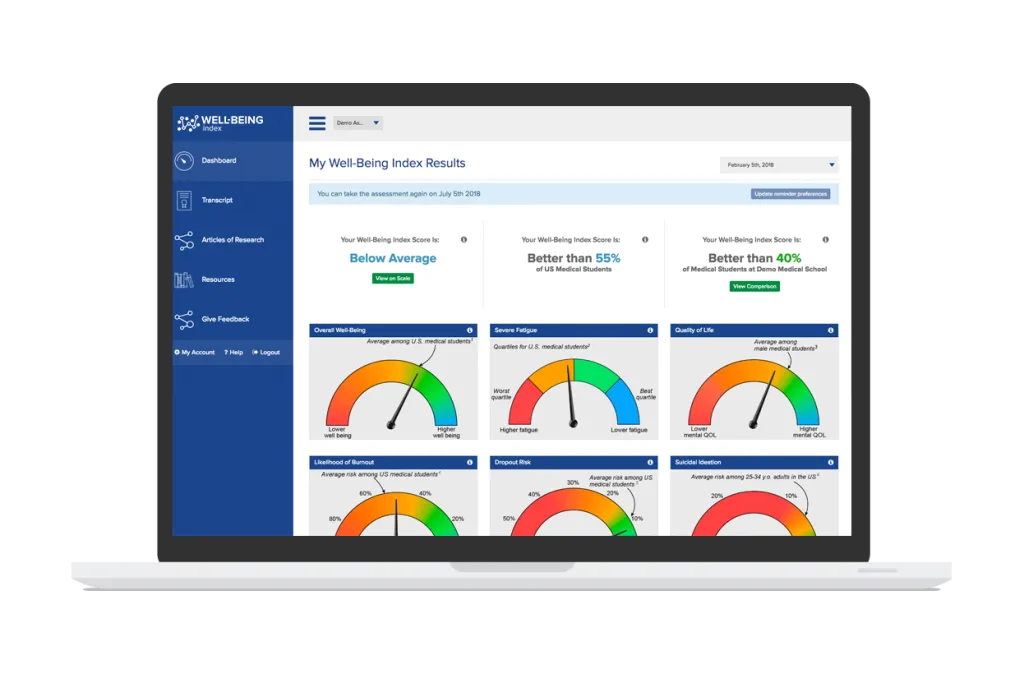
From leading national health systems to independent hospitals, small groups, and associations, the Well-Being Index provides the data and tools needed to Go Beyond Burnout. View and download the Well-Being Index case studies below.
Learn more about the Well-Being IndexExperience the Well-Being Index for yourself
Share this report: