
What's New in the Well-Being Index: From Data to Decisions, Faster
If you're running well-being assessments across a large or multi-location workforce, you already know the hard part isn't collecting the data; it's knowing what to do with it. Which locations need attention first? What's actually driving low scores? And how do you make sense of thousands of open-ended comments without reading every single one?
Our latest release to the Well-Being Index platform is built to answer exactly those questions. Three updates: a new Priority Dashboard, enhanced Snapshot Reports with Hotspots & Bright Spots, and Auto-Categorized Feedback Themes. These three updates work together to shorten the distance between “we have the data” and “we know what to do next.”
Know where to focus first: the Priority Dashboard
Large organizations often run assessments across dozens of locations, departments, or job groups, then have to manually dig through multiple reports to figure out where the real risk sits. The new Priority Dashboard removes that guesswork.
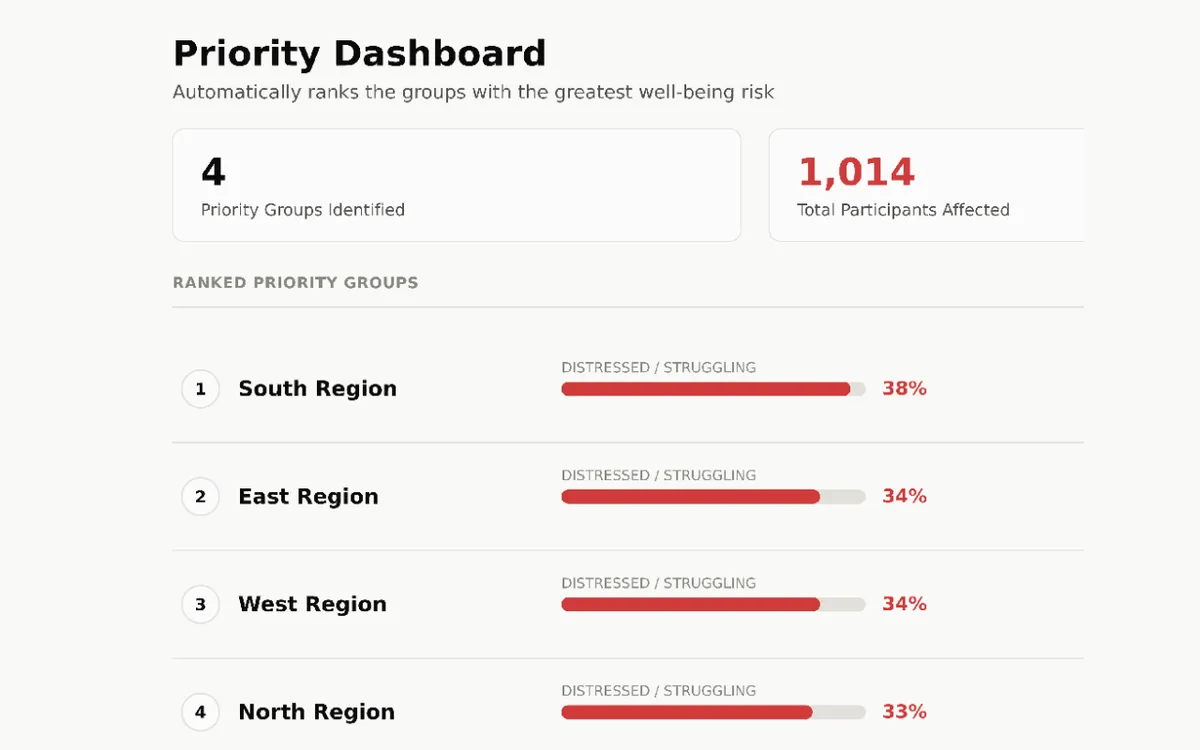
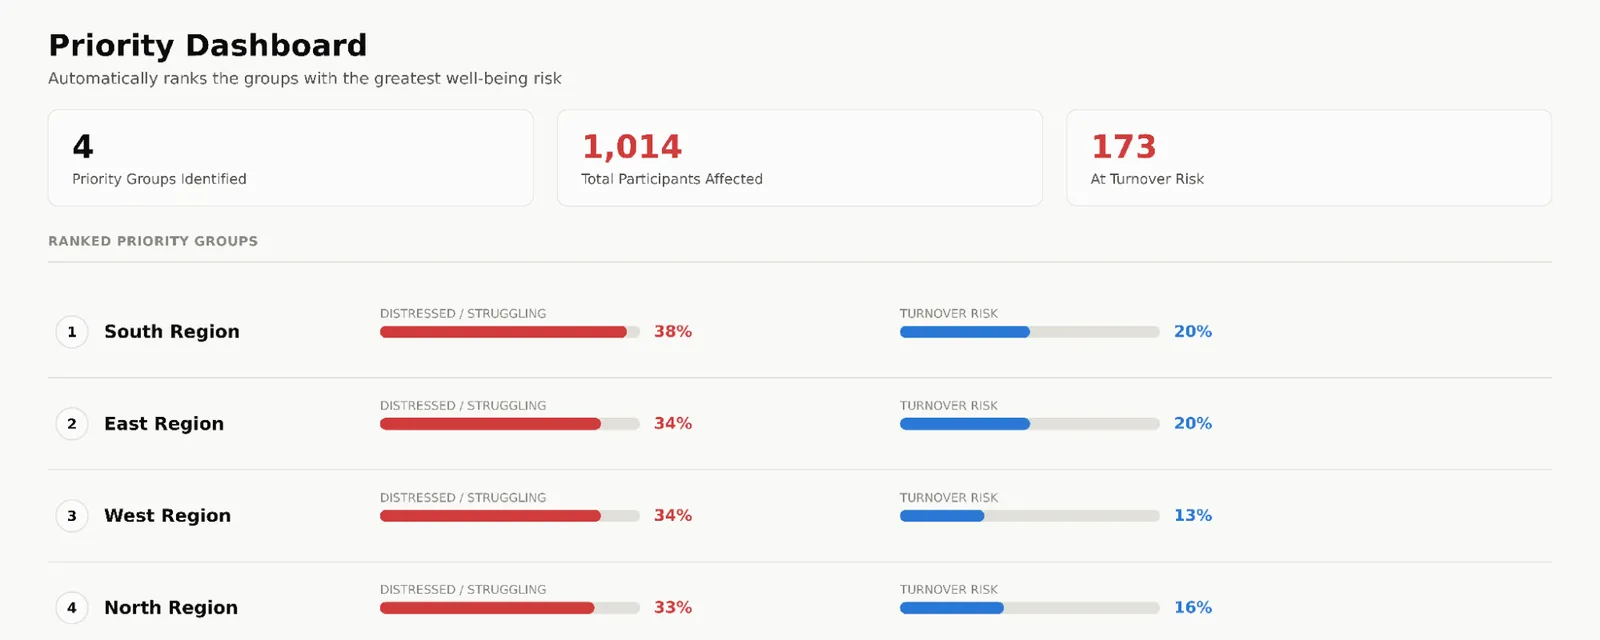
Set a risk threshold and a minimum participant count, and the dashboard automatically ranks your highest-risk groups—surfacing the percentage of employees who are distressed or struggling, potential turnover risk, and total participants affected, all in one ranked view. Instead of starting an investigation, administrators start with the answer: which groups need attention first, and how big the impact is if nothing changes.
See the full picture: Hotspots & Bright Spots in a Snapshot Report
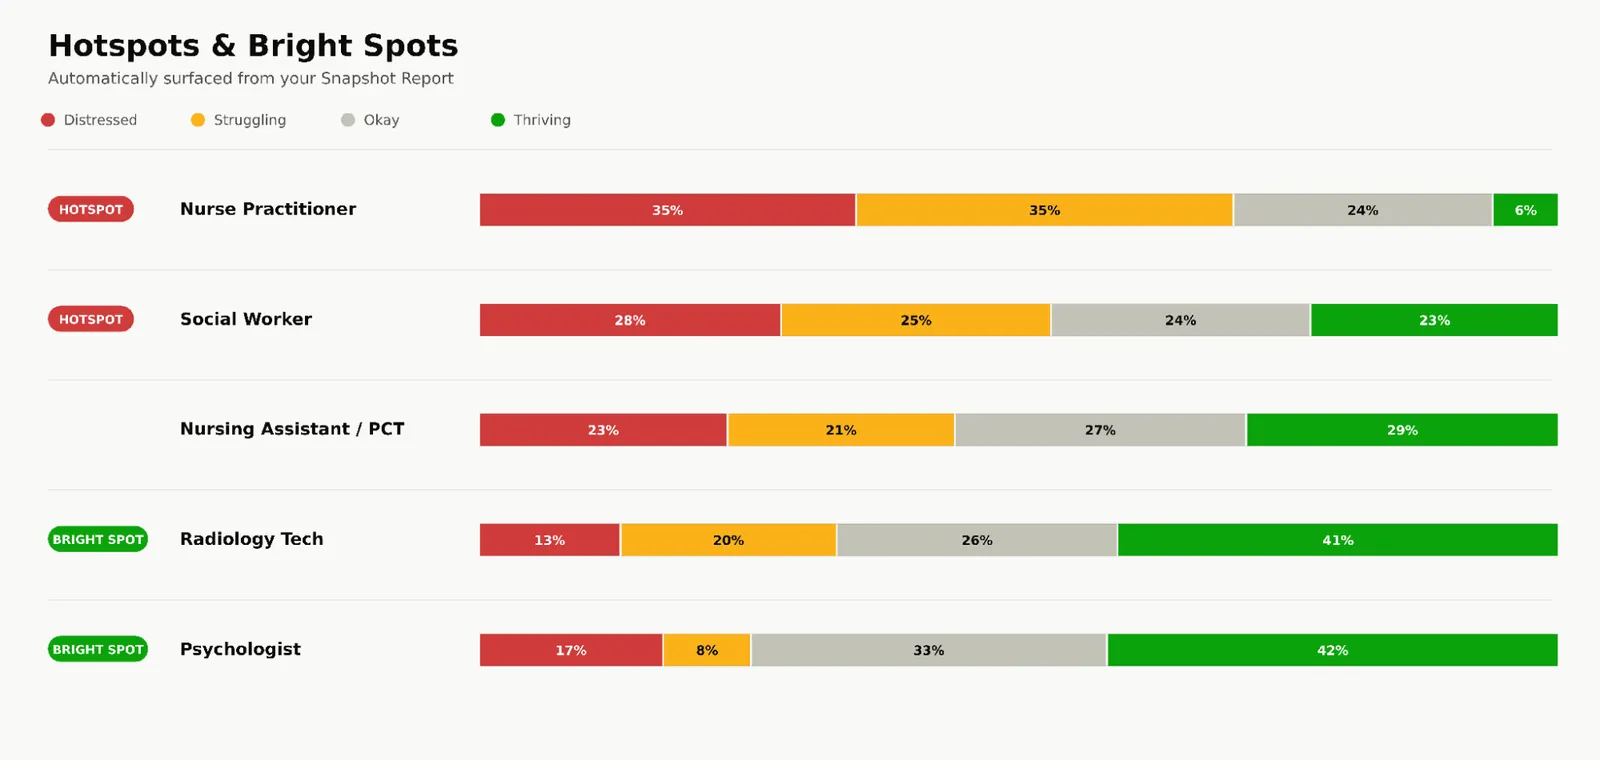
Well-being data usually tells two stories at once: where things are breaking down, and where they're actually going well. Our new Enhanced Snapshot Reports now surface both automatically. The updated Hotspots and Bright Spots view flags occupations or groups with the highest concentration of distress alongside those that are thriving, so leaders don't just chase problems—they can also identify what's working and replicate it elsewhere.
Saved views and automated report configuration mean administrators no longer have to rebuild the same report every reporting cycle. Set it up once, and revisit the exact view that matters to your organization on demand.
Let the Well-Being Index automatically sort open-ended responses so you don't have to
Anonymous open-ended feedback is often where the most honest insight lives—and where it's easiest to lose it in volume. With thousands of responses to a single question, manual review simply doesn't scale.
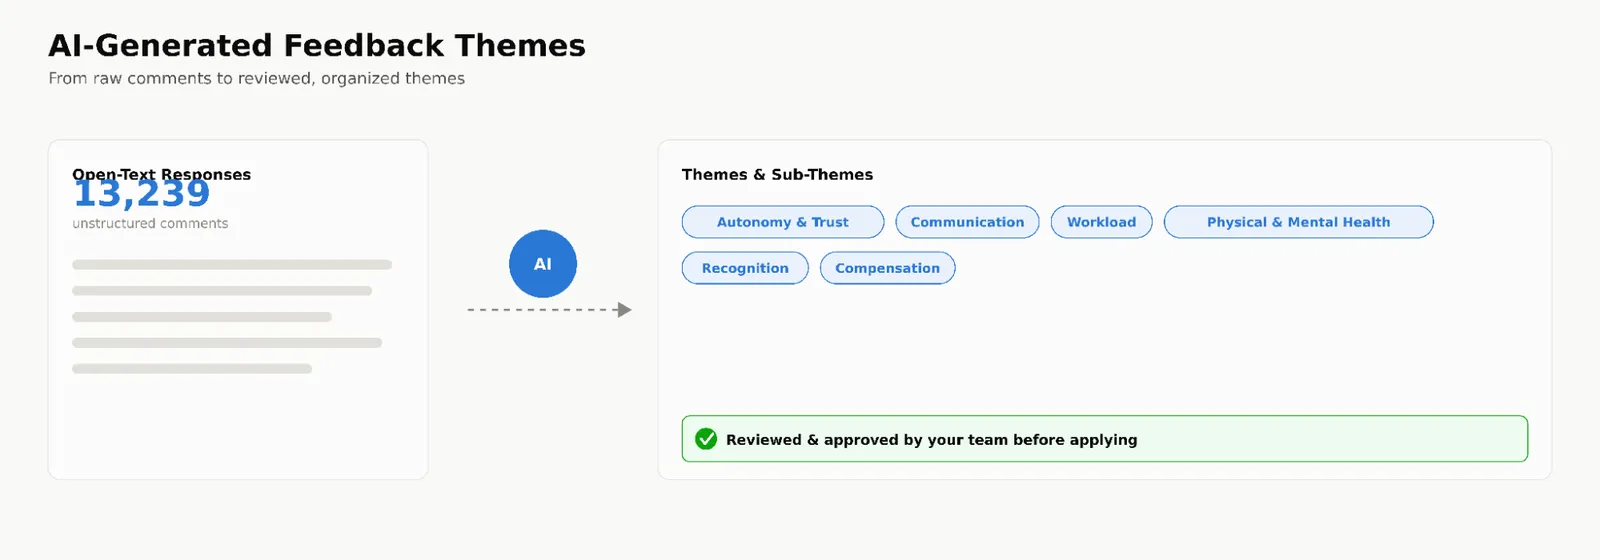
The Well-Being Index’s new Auto-Categorized Feedback Themes change that. Our secure in-app AI analyzes open-text responses and organizes them into themes and sub-themes automatically, so administrators can see recurring concerns—like communication, autonomy, or workload—at a glance instead of scrolling through raw comments. Critically, administrators stay in the driver's seat: themes are reviewed and approved before being applied, and can be edited to match your organization's language and context. It's AI-assisted analysis with human judgment still calling the shots.
Built for Action, Not Just Reporting
Individually, each of these updates saves time. Together, they change the workflow: the Priority Dashboard tells you where to look, Hotspots & Bright Spots tell you what's happening there, and Auto-Categorized Feedback Themes tell you why—all without days of manual report-building. That's the goal of the Well-Being Index: not just measuring well-being, but making it actionable.
Frequently Asked Questions
What is the Priority Dashboard in the Well-Being Index?
It's a reporting view that automatically ranks groups, locations, or departments by well-being risk—based on a threshold you set—so administrators can immediately see which groups need intervention and how many employees are affected.
What are Hotspots and Bright Spots in Snapshot Reports?
Hotspots highlight the groups with the highest levels of distress or struggle; Bright Spots highlight groups that are thriving. Together they give a balanced view of both risk areas and strengths within a single report.
How does Auto-Categorized Feedback Theme analysis work?
The AI scans open-text survey responses and groups them into themes and sub-themes based on common topics. Administrators review and approve a sample before the tool tags the full data set, and can edit the themes using their own organizational context and expertise.
Ready to See It in Action?
Not yet a Well-Being Index client? Request a Guided Demo to see how the Priority Dashboard, Hotspots & Bright Spots, and Auto-Categorized Feedback Themes can help your organization move from data to action faster.
Already using the Well-Being Index? These features are available now—reach out to your account team to get your dashboards and saved reports configured.
More from the blog

Physician Burnout Treatment: Assessment-First Approaches That Work
Discover why effective physician burnout treatment starts with validated assessment. Learn evidence-based approaches that measure distress and drive… Read the article
Preventing Physician Burnout: Evidence-Based Organizational Strategies
Discover proven organizational strategies for preventing physician burnout. Learn the four-step framework that reduces distress and improves retention. Read the article
Provider Burnout Across Healthcare: Comparing Physicians, NPs, and PAs
Provider burnout affects physicians, NPs, and PAs differently. Learn the unique challenges each role faces and how to measure and address burnout across… Read the articleYou can't improve what you don't measure. Start today.
See what burnout is really costing your organization, or take a self-guided look at the platform.